20


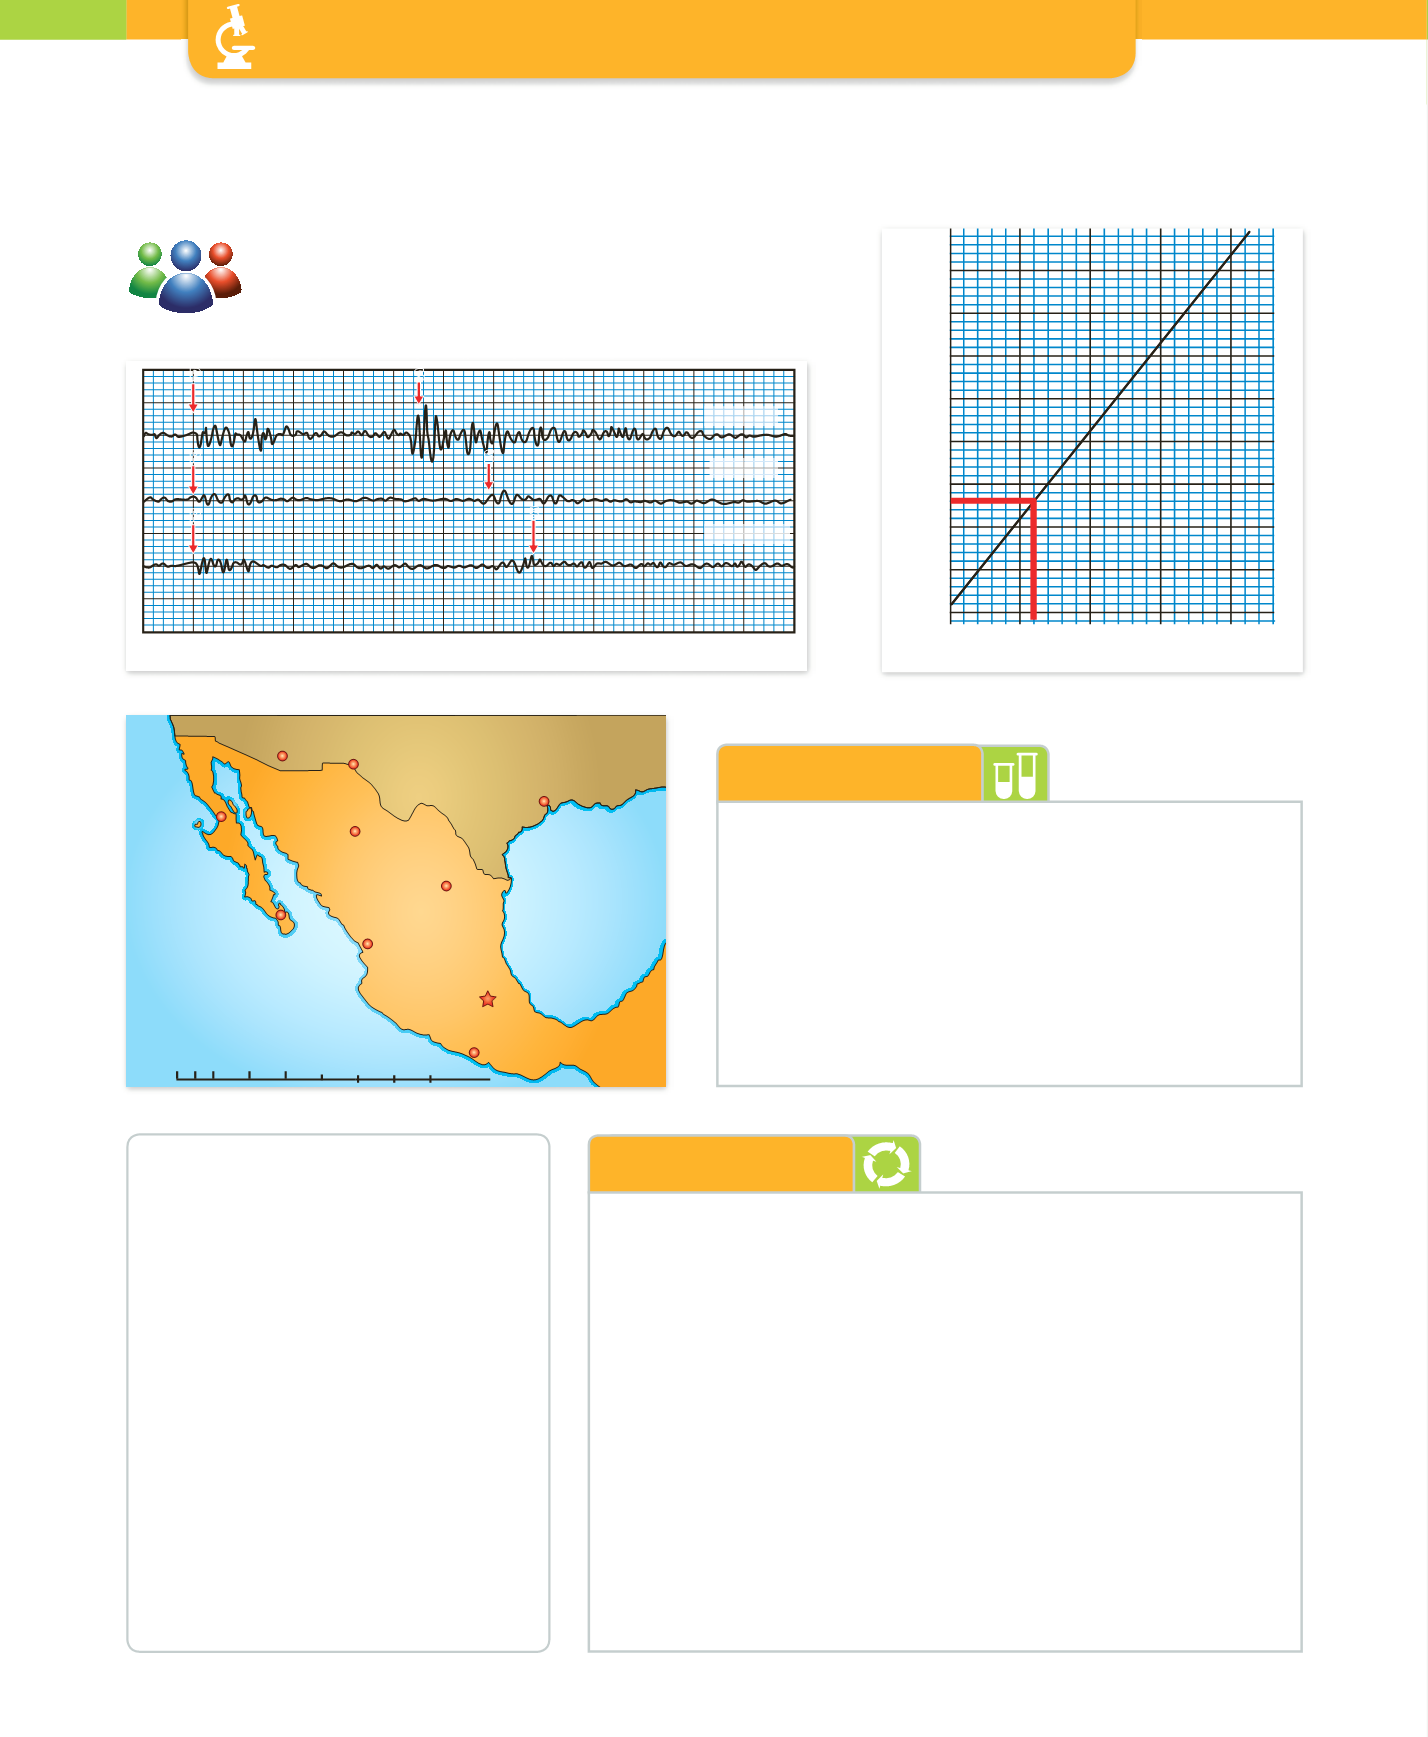
          How to locate an earthquake
        
        
          WORK AND EXPERIMENTATION TECHNIQUES
        
        
          300        400        500        600        700
        
        
          70
        
        
          60
        
        
          50
        
        
          40
        
        
          30
        
        
          Time (s)
        
        
          Distance


            United States


          Tucson
        
        
          El Paso
        
        
          Houston
        
        
          Chihuahua
        
        
          Rosarito
        
        
          La Paz
        
        
          Mazatlán
        
        
          Acapulco
        
        
          Mexico
        
        
          Monterrey
        
        
          0   100 200 300 400 500 600 700
        
        
          Km
        
        
          Materials
        
        
          ❚❚
        
        
          Three seismograms from the same earthquake from three
        
        
          different seismic stations
        
        
          ❚❚
        
        
          Map of the location of the three seismic stations with a
        
        
          scale
        
        
          ❚❚
        
        
          Graph of the calculated distance of the delay between
        
        
          the arrival of P and S waves
        
        
          ❚❚
        
        
          Ruler and compass
        
        
          ❚❚
        
        
          Calculator
        
        
          1.
        
        
          Use a seismogram to work out the delay, in seconds, between the
        
        
          arrival of the P waves and S waves.
        
        
          2.
        
        
          Put this value on the vertical axis that represents the time (at the
        
        
          Mazatlán station, 43) and extend it until the S-P line.
        
        
          3.
        
        
          Go down vertically to the horizontal axis to obtain the distance
        
        
          corresponding to the delay (420 km in the example).
        
        
          4.
        
        
          Repeat the process with the other two seismograms. In this way you
        
        
          will know the distance of the earthquake from each station.
        
        
          5.
        
        
          Use thegraphic scaleon themap to convert thedistances to centimetres.
        
        
          6.
        
        
          Copy the map on a sheet of paper. Draw a circumference around
        
        
          each station with the same radius as the distance to the epicentre.
        
        
          For this, use the graphic scale. The epicentre is located where the
        
        
          circumferences overlap.
        
        
          Procedure
        
        
          Using what you have studied in the unit, you can use a
        
        
          seismogram to calculate the distance of an earthquake
        
        
          and locate the epicentre.
        
        
          0      10      20     30      40      50     60      70     80      90    100    110
        
        
          Time delay between waves P and S (s)
        
        
          Mazatlán
        
        
          Rosarito
        
        
          Chihuahua
        
        
          P
        
        
          P
        
        
          P
        
        
          S
        
        
          S
        
        
          S
        
        
          1.
        
        
          A cyclist and a motorcyclist leave
        
        
          the same point at the same time.
        
        
          Calculate the delay between their
        
        
          arrival times.
        
        
          2.
        
        
          What relation is there between the
        
        
          previous example and P waves and S
        
        
          waves recorded on the seismogram?
        
        
          3.
        
        
          What relation can you find between
        
        
          the S-P delay and the amplitude of the
        
        
          vibrations on the seismogram?
        
        
          4.
        
        
          What city is the epicentre of this
        
        
          earthquake in? Explain in your own
        
        
          words the process you followed.
        
        
          5.
        
        
          What would the seismogram of a
        
        
          station very near the earthquake
        
        
          be like?