1
1. The world’s natural environment
13
REPRESENTING THE EARTH: CARTOGRAPHY
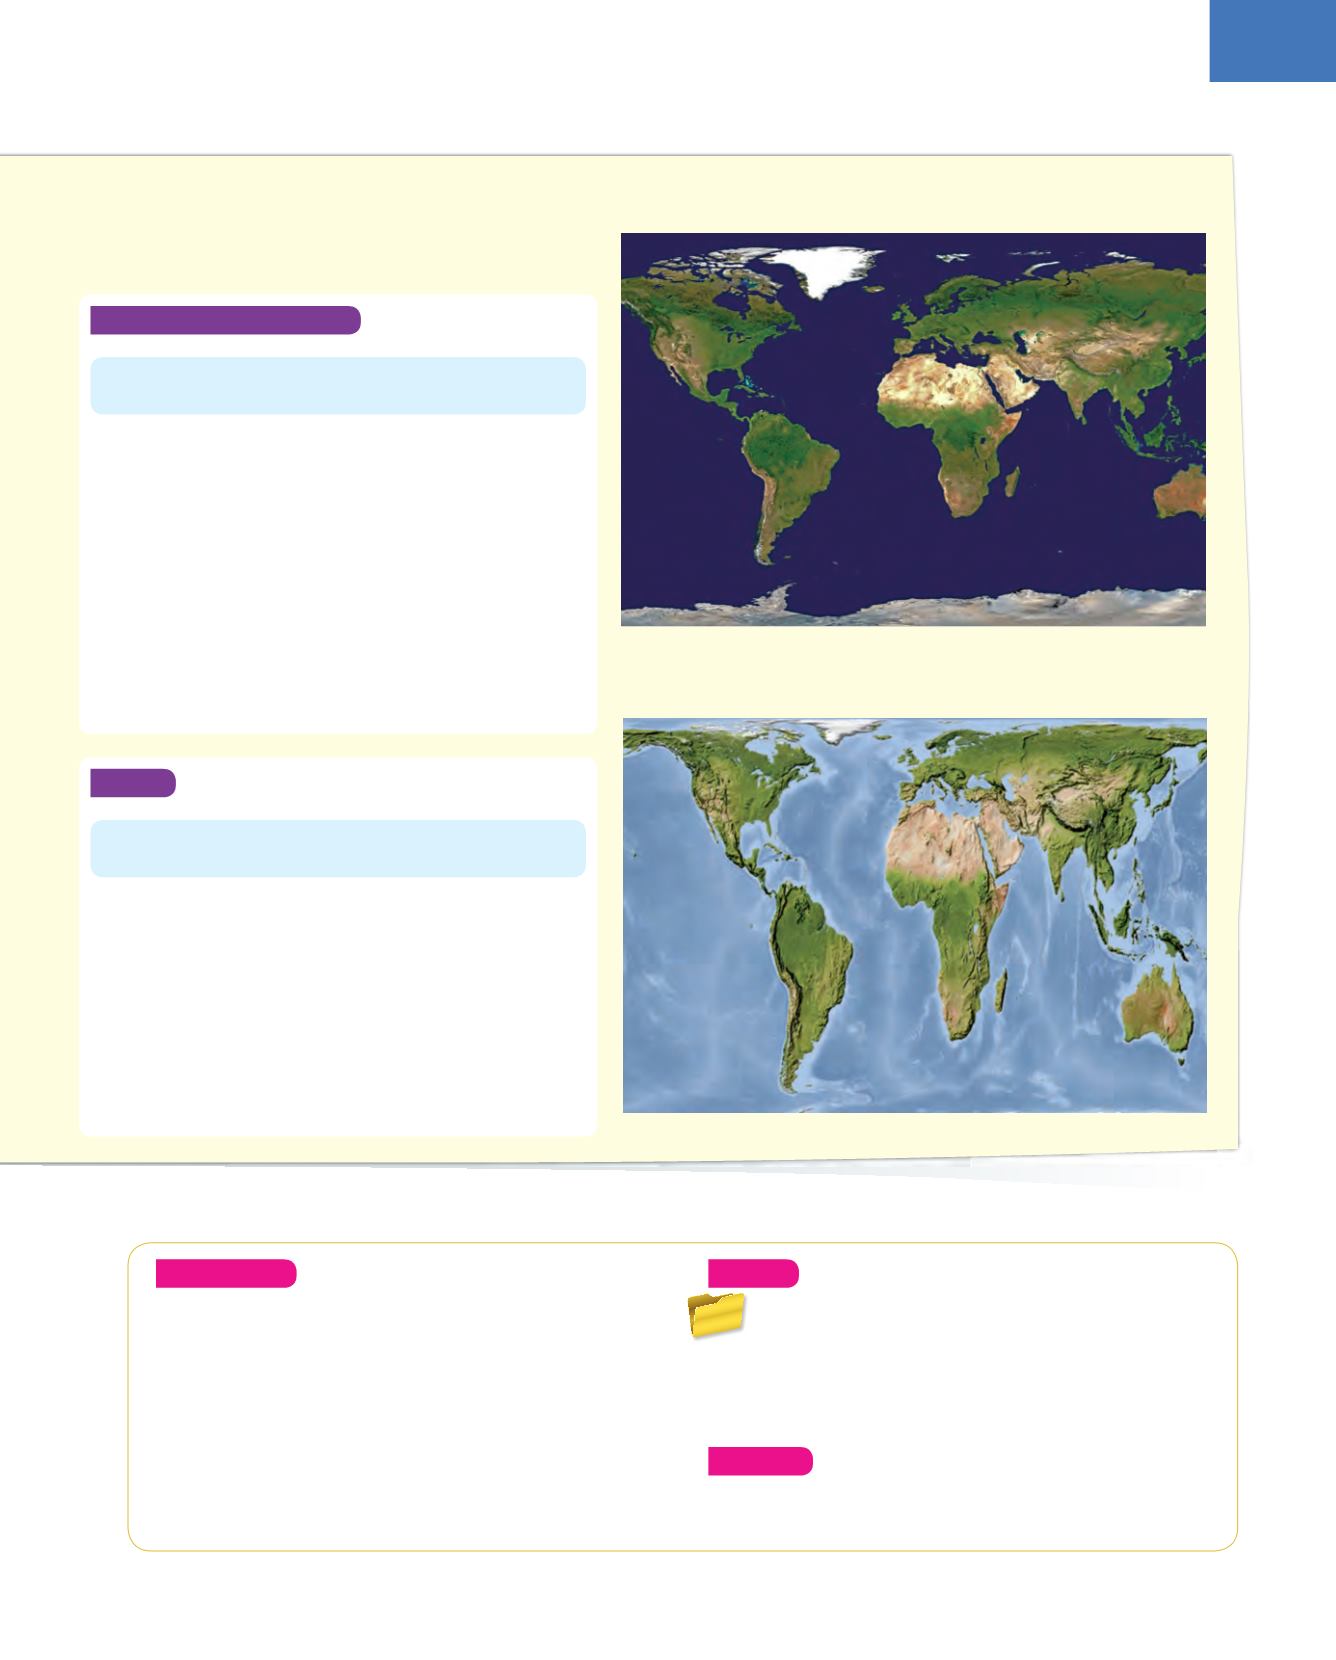
Gall-Peters projection
Mercator projection
Cartographic projections
The main projections are
cylindrical
,
conical
and
azimuthal
.
Cylindrical projections represent a complete picture of the world and
are the most common. The best known cylindrical projections are
those of Mercator and Gall-Peters.
❚
TheMercator projection
(top right) wasmade byGerardusMercator
in 1569 and represents the entire world. It isn’t a representation of
the real surface area, as it exaggerates the size of the areas near the
poles, but it allowed navigators to follow the right course.
❚
The Gall-Peters projection
was made in 1856 by James Gall and
updated in 1974 by Arno Peters. It represents the real surface area,
but it distorts the shape of the countries situated in the tropics,
making them elongated. The countries in the medium and high
latitudes of the northern hemisphere are made smaller.
Cartographic projections are ways of representing a sphere
on a flat surface.
Scale
Scales are essential for reading maps. They are expressed in fractions.
The numerator is the unit of measurement that the map was made in
and the denominator is the number of times that this unit has to be
multiplied. There are small, medium and small scale maps.
Numerical scale
❚
Large
: 1:10000-1:100000 (cities and towns).
❚
Medium
: 1:100000-1:500000 (provinces, regions and small
countries).
❚
Small
: 1:500000-1:50000000 (large countries and continents).
Scale is the proportional relation between what is represented
on the map and reality.
Two important aspects in the making and reading of maps are
cartographic projections and scale.
Understand
1.
What aspects of physical geography can be described in
the photo of Yosemite falls, on page 12? What aspects
of humanised landscapes does human geography
study?
2.
What regions of the planet are too big in Mercator
projections? How are the countries distorted in the Gall-
Peters map projections?
3.
What do small scale and large scale maps represent?
Create
4.
Find information on the Internet about Gerardus
Mercator. When and where did he live? What were
his main contributions? Write a 10-15 line essay
about this cartographer. Explain why cartography
developed so much in his era.
Analyse
14.
Consult a political world map and find out what
information is listed on the sides or in boxes.


