11
1. The scientific method
www
4.2.
Experimentation and analysis of results
When we have researched and defined our objectives, we can formulate a
hypothesis. We design our experiments based on our hypothesis. For our project,
we can formulate two hypotheses:
❚
Hypothesis 1
: beans are dead so they don’t germinate.
❚
Hypothesis 2
: the conditions inside the bean packet are not right for germination.
We are going to choose hypothesis 2.
4.2.1.
Designing experiments
We are going to design experiments to test our hypothesis. After we have
completed our experiment we will interpret the results and see if the hypothesis
is true or not.
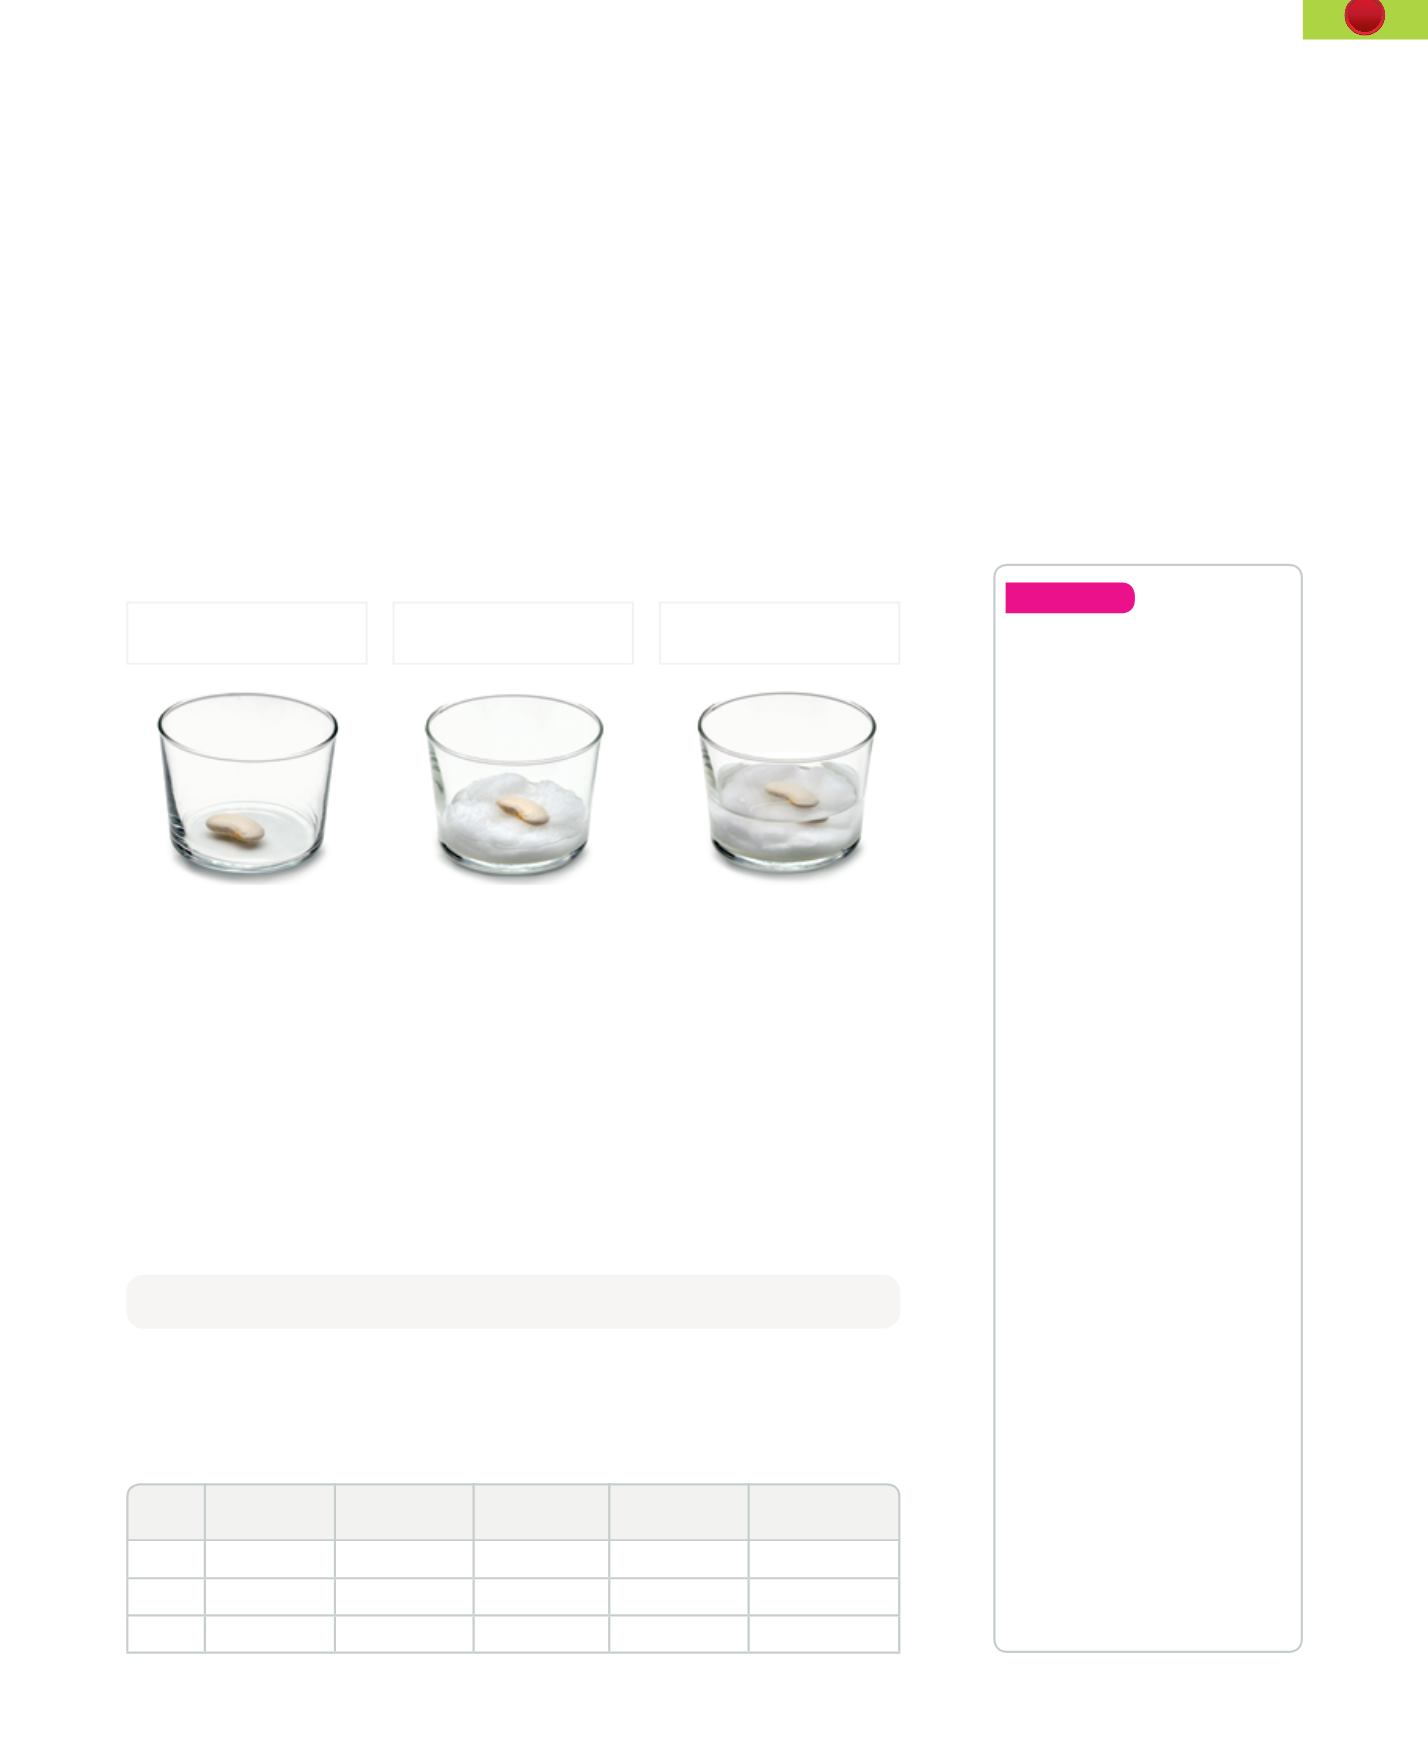
We will carry out an experiment to germinate beans in different conditions:
Analyse
8.
After the final tests for
Secondary 1, 4 students
from Class A got more
than a 9, 6 students from
Class B, and 3 students
from Class C. 8 students
in Class A got between
7 and 9, 6 in Class B and
7 in Class C. 12 students
in Class A got between
5 and 7, 10 from Class
B and 11 from Class C.
6 students from Class A
got less than 5, 8 from
Class B, and 9 from Class
C. Make a table with the
information. What data
will you put in the first
column?
9.
After finding out the
percentage of students
with a specific mark, you
must multiply the number
of studentswith this grade
by 100 and divide the
result between the number
of students. For example,
to find the percentage
of students in Class A
with more than 9, the
calculation is 4 x 100 /30
= 13.33%. Calculate the
percentage of students
with less than 5 for each
of the classes.
Germination
day
2
nd
day after
germination
4
th
day after
germination
6
th
day after
germination
8
th
day after
germination
Glass 1
-
0 cm 0 cm
0 cm
0 cm
Glass 2
Day 4
1 cm 3 cm
5 cm
7 cm
Glass 3
Day 6
2 cm 4 cm
5 cm It rots and dies
Ifwewant toobservehowother variables influencegermination, suchas temperature
or light, we have to design different experiments. For example, cover the glasses or
put them in places with different temperatures (in the sun or the fridge) to see what
happens.
We need to record our observations and measurements in our logbook every day.
It is important to record as much information as possible, for example, date of
germination, daily growth and when the first leaves appear. Then we can compare
germination and growth in the three conditions.
Scientists use tables andgraphs tohelp them interpret the results of their experiments.
4.2.2.
Making a data table
The first column on the left is for the data that does not change or changes in a
controlled way. The other columns are for recording the data that changes. For
example:
In a
data table
information is organised in rows and columns.
Glass 1:
a bean without
cotton wool or water
Glass 2:
a bean in cotton
wool and a little water
Glass 3:
a bean in cotton
wool and lots of water


